
Amber Valley, Derbyshire
311 days of sewage in six years
Seven Severn Trent storm overflows discharge into the River Erewash and Bailey Brook inside our parish. Between 2020 and 2025 they ran for 7,464 hours. That is not an estimate. It is Severn Trent’s own figure, filed with the Environment Agency.
And this year is worse
Those six years are the Environment Agency’s published returns, and the most recent one covers 2025. The return for 2026 will not be published until around March 2027.
So I keep my own count, discharge by discharge. Since 1 January 2026 the outfalls in this parish have discharged … across … discharges, already … of the whole of 2025, with four months of the year still to run, and the wettest of them still to come.
And right now
Checking Severn Trent’s feed…
Almost none of this broke a rule
That is the part worth sitting with. A storm overflow is allowed to discharge when heavy rain would otherwise back sewage up into people’s homes. I tested every one of the 693 individual discharges recorded in 2024 and 2025 against the Environment Agency’s own dry-day test, using six of the Agency’s own rain gauges, and two of them happened in dry weather. Together they lasted exactly an hour.
So Severn Trent can point at almost every one of those 7,464 hours and say it was permitted. They would be right. The system is not failing. This is the system working as designed, and it is designed to let raw sewage into the Erewash for the equivalent of ten months out of six years.
Permits are set by the Environment Agency. Investment is agreed with Ofwat. Both answer to government. Those are decisions, and decisions can be changed.
Why is rainwater in the sewer at all?
This is the part that surprises most people, and it is worth understanding before anything else on this page. In most of this country, including here, the sewers are combined: one pipe carries the foul water from your toilet, sink and washing machine and the rain off your roof, your street and the road gullies. It was built that way and it was never separated. Storm overflows exist only because of that decision.
In dry weather that pipe carries a modest, steady flow of sewage, and all of it reaches the works and is treated. In heavy rain the same pipe can be carrying many times as much. The works cannot simply treat it all: treatment is largely biological, and a sudden surge would wash the process out. So what arrives is dealt with in three stages, and only the first of them is treatment.
- Treated. The works takes everything up to a flow rate set in its permit and treats it properly.
- Stored. Above that rate, the excess is diverted into storm tanks and held. If the rain stops in time, the tanks are drained back into the works and treated then. That is what the tanks are for: to buy time, not to get rid of anything.
- Discharged. If the tanks fill as well, they overflow into the river. That is a storm overflow. It has sat long enough for the heavier solids to settle out, but it has not been treated. The Environment Agency’s own name for what it samples at Milnhay is “settled storm sewage”.
A CSO further up the network is cruder still. It spills before the flow ever reaches a works, so nothing has settled and nothing has been treated. Five of the seven outfalls on this page are that kind.
So the honest answer to “is the storm water treated?” is: the first part of it is, the stored part usually is, and the part that reaches the river is not. It is rain mixed with sewage, and the argument for allowing it is that the more rain there is, the more diluted it gets.
It also explains why enlarging the Milnhay storm tanks from 2 megalitres to 7 did not fix this. A bigger tank absorbs more rain before it overflows. It does not add any treatment capacity. Severn Trent’s own return names the cause here as “hydraulic capacity”: more is arriving than the works can take.
Where it goes in
The seven outfalls inside the parish boundary. Click one for its year-by-year record. The layers button, top right, adds every permitted discharge point on the Environment Agency’s register.
- Discharging right now
- Discharges into the River Erewash
- Discharges into Bailey Brook
- Bigger dot, more sewage since 2020
- Parish boundary
- Permitted discharge, monitored
- Permitted, no monitor
Outfall by outfall
Total hours of discharge, 2020 to 2025. One site accounts for most of it.
Spill counts are the Environment Agency’s, using their 12–24 hour counting method: a block of discharges within twelve hours counts as one spill. The number of times an outfall actually opened is higher.
Not one clean year
Hours of discharge per year across all seven outfalls. What does not change is that it happens, every year, without exception.
The two gaps, and what they actually are
Two years show fewer than seven outfalls reporting, and neither gap is a hidden number. Both Milnhay monitors were installed in 2021, so 2020 has five outfalls simply because the other two were not yet being measured.
2025 is different. The inlet overflow at Milnhay works, on its own responsible for 1,757 hours of discharge since 2021, was decommissioned in January 2025. Severn Trent’s return records it as “no longer operational as an overflow, permit revoked or to be revoked” and “no longer spilling to environment”. That one really is gone, and this page says so, because a page that only reports bad news is not worth reading.
It was part of something bigger. Between 2022 and 2024 Severn Trent spent around £35.8 million rebuilding Newthorpe works, south of Eastwood, and shut Milnhay down as a treatment works altogether. Milnhay is now a pumping station: what it collects is pumped 2.5 km to Newthorpe and treated there. Only the storm tanks were kept here, and their capacity was raised from 2 megalitres to 7.
That scheme was built to meet the Water Framework Directive and, specifically, tighter limits on phosphate that came into force in December 2024. This river was classified Poor in 2016 and has been Poor at every assessment since. The works discharged into it throughout those eight years. What changed was not the state of the Erewash, which was on the record the whole time. What changed was the law.
And it has not fixed it. The storm tank they enlarged discharged for 305 hours in 2025, the first full year after the work was finished. By 1 September 2026 it had already discharged for 266 hours, with four months of the year still to run. It remains the largest single source in the parish, and the live feed above records it discharging into the Erewash within the last few days. Across the parish as a whole the shape is the same: 700 hours in 2025, and 606 so far this year.
So one of the two outfalls at Milnhay has stopped, and the other has not. The decommissioned one no longer appears on Severn Trent’s live map at all, which is the clearest confirmation that it really has gone.
“It was just a wet year”
That is the first thing you will be told, so it is worth checking. Rainfall measured at six Environment Agency gauges around the parish, averaged, against discharge, year by year:
Rain explains some of it: 2023 was the wettest year and one of the worst. But it does not explain most of it. 2021 was drier than 2020 and produced six times as much discharge. The correlation across the six years is 0.52, real but far from the whole story. The rest is what condition the network is in and how much is being asked of it. Severn Trent’s own return names the cause at Milnhay: “hydraulic capacity”. The works cannot take what is being put into it.
The dry-day test
A storm overflow that discharges when it has not rained has a problem: a blockage, a broken pump, or not enough capacity. The Environment Agency defines this precisely:
“A dry day spill is when a storm overflow is used on a ‘dry day’ – which is defined as no rainfall above 0.25mm on that day and the preceding 24 hours.”
Environment Agency, August 2024
0.25 mm sounds like almost nothing, and it is. Spread over a square metre it comes to a quarter of a litre, about a mugful, and that is the whole day’s rain. It is a tenth of what falls on an ordinary wet day here, and one part in three thousand of a year’s rainfall. You would not put the wipers on for it. A heavy dew leaves about as much.
There is a neater way to picture it. A rain gauge is not a measuring jug. It is a funnel feeding a tiny see-saw with a bucket on each end: rain fills the raised bucket until it overbalances, tips out, and swings the other one up to take over. Every tip is counted, and on these gauges one tip is 0.2 mm.
So the gauge cannot report anything finer than a single tip, and it doesn’t. All 13,164 daily readings behind this page are exact multiples of 0.2 mm, and below 1.2 mm the only readings that exist anywhere in the data are 0.0, 0.2, 0.4, 0.6, 0.8 and 1.0. The Agency’s threshold falls in the gap between one tip and two. A dry day is a day the rain gauge tipped once, or not at all.
I applied that test to every discharge Severn Trent recorded here in 2024 and 2025, the only two years for which they publish the start and stop time of each one. The result:
Two dry-day discharges in two years
- Milnhay works storm tank, 8 November 2024, 5.19pm, 25 minutes. All six gauges recorded no rain that day or the day before.
- Cromford Road No 3, 2 July 2025, 4.56am, 35 minutes. Five of the six gauges agreed; the sixth recorded 0.2 mm.
The Environment Agency treats a dry-day spill as a potential permit breach until it has been investigated, not as proof of one. There are legitimate explanations: a large catchment can still be draining down long after the rain stops. I am not alleging that Severn Trent broke the law here, and this page should not be read as saying so.
How I tested it
Rainfall comes from six Environment Agency rain gauges around the parish, between 5.7 km and 14.2 km away: Watnall, Denby Pottery, Newstead Abbey, Sutton-in-Ashfield, Ogston and Draycott. A discharge is only counted when at least three quarters of them agree that both days were dry.
Asking six rather than the nearest one matters more than it sounds. Over these two years the wettest of the six recorded 1,878 mm and the driest 1,429 mm, and even the two nearest gauges disagree about whether a given day was dry roughly one day in twelve. A single gauge would have given a different answer, and so would a weather model.
Did I pick a convenient threshold?
It is the obvious objection to any test with a number in it, so here is every other number I could have picked, run over the same 693 discharges:
The answer does not move. Anywhere between 0.2 mm and 0.5 mm you get the same two discharges. The count is flat across a band either side of the Environment Agency’s figure rather than balanced on it. It only starts to climb at 1 mm, which is no longer a dry day by any reasonable reading.
Part of the reason is those tipping buckets. Because the gauges only ever report in steps of 0.2 mm, there are no readings between one tip and two for a threshold to land on, so moving the line anywhere inside that gap changes nothing at all. The test is more robust than a decimal place makes it look.
The ones that only just fail
Five discharges would count if the line were drawn at 1 mm instead. Three of them are the same outfall on the same day, lettered A, B and C below. They are worth looking at, because of how they fail:
Look at which column disqualifies them. On four of the five, the day of the discharge was itself dry by the Agency’s own measure, at or below 0.25 mm across the gauges. What rules them out is a trace on the day before: two tenths of a millimetre, in one case one and a half.
The Environment Agency includes the preceding 24 hours deliberately, because a catchment goes on draining long after rain stops. Rain on the day before is a plausible explanation for a discharge on the day after, so all five stay out of my count. It is still worth knowing that on 19 February 2024, a day on which the gauges recorded at most two tenths of a millimetre, Milnhay works discharged into the Erewash three times for more than eleven hours in total.
I am publishing all of this even though the headline number is small, because the honest finding matters more than a convenient one. The case against what is happening in this parish does not need a scandal. 7,464 lawful hours is the scandal.
Where it ends up
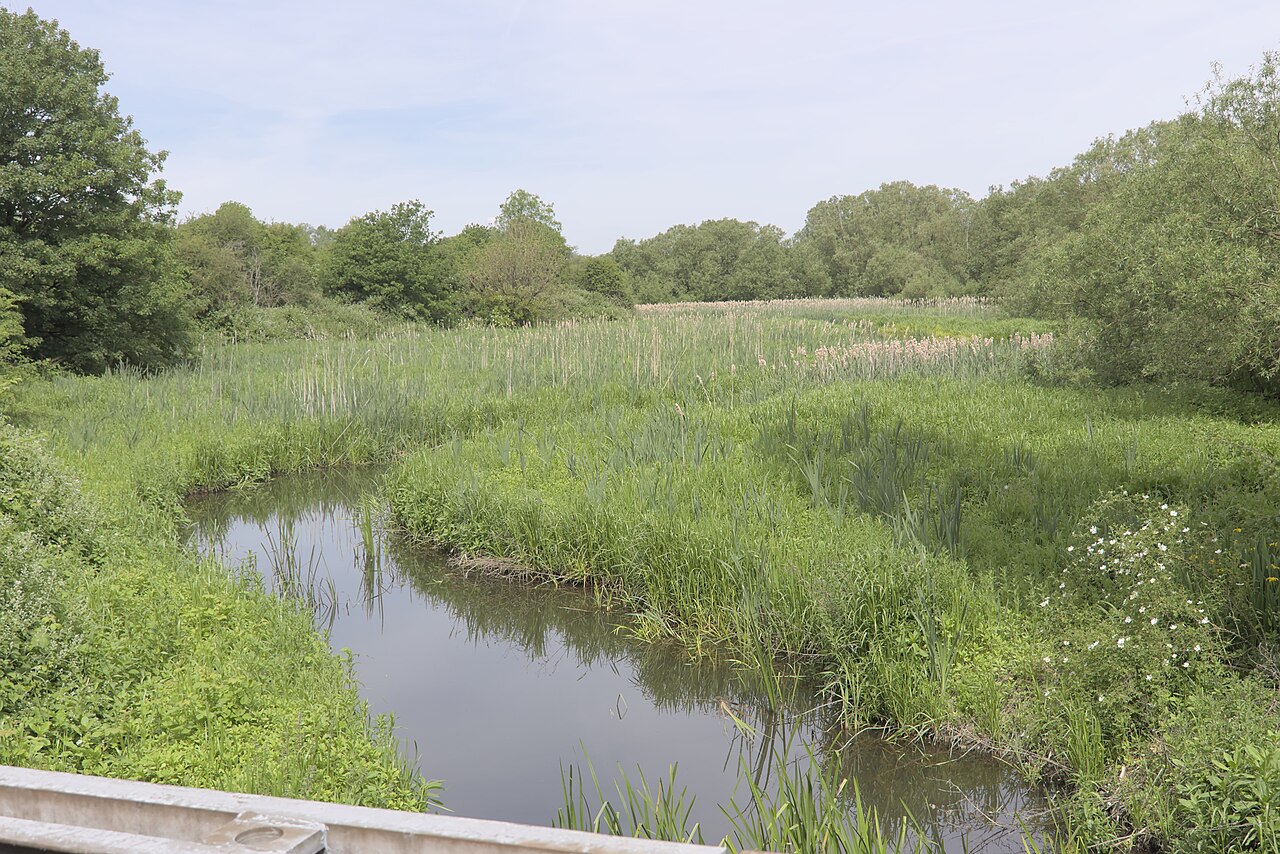
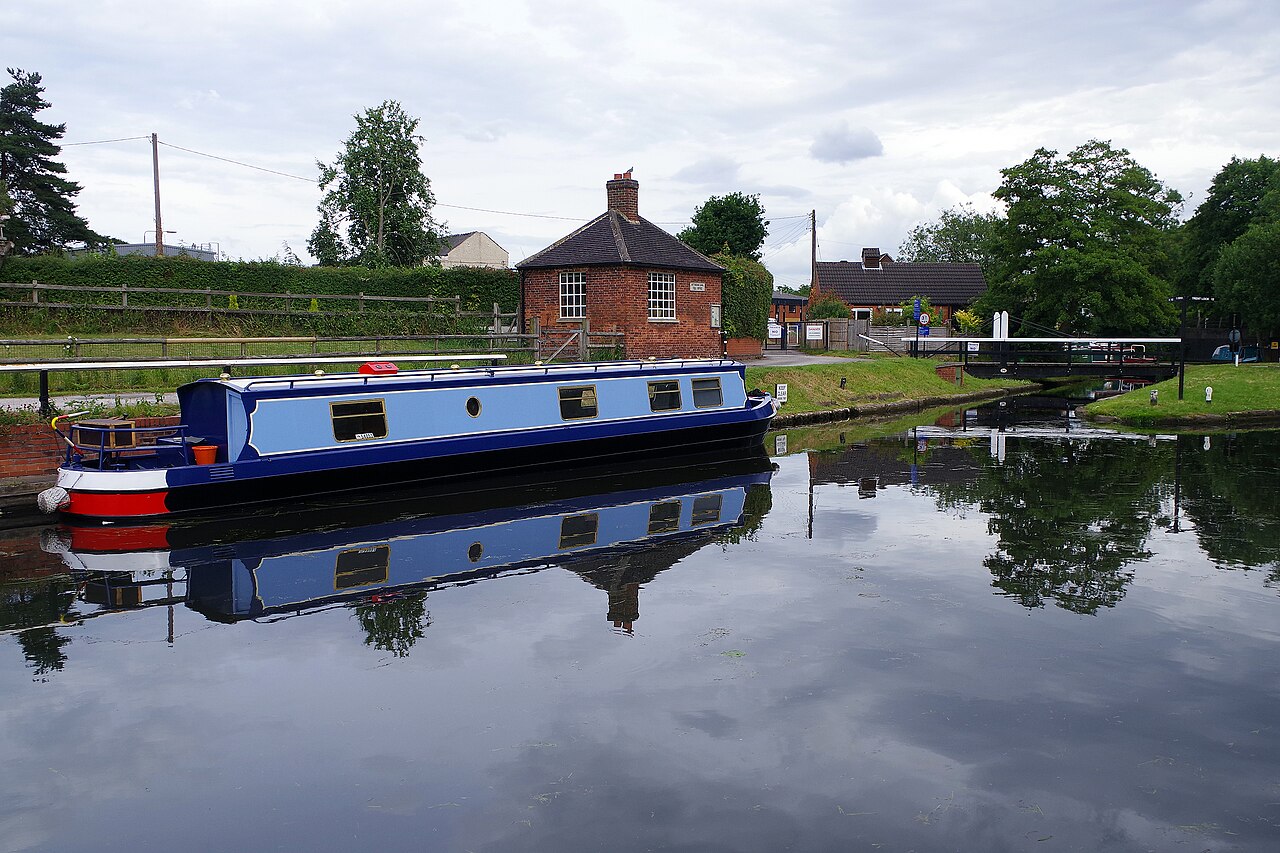
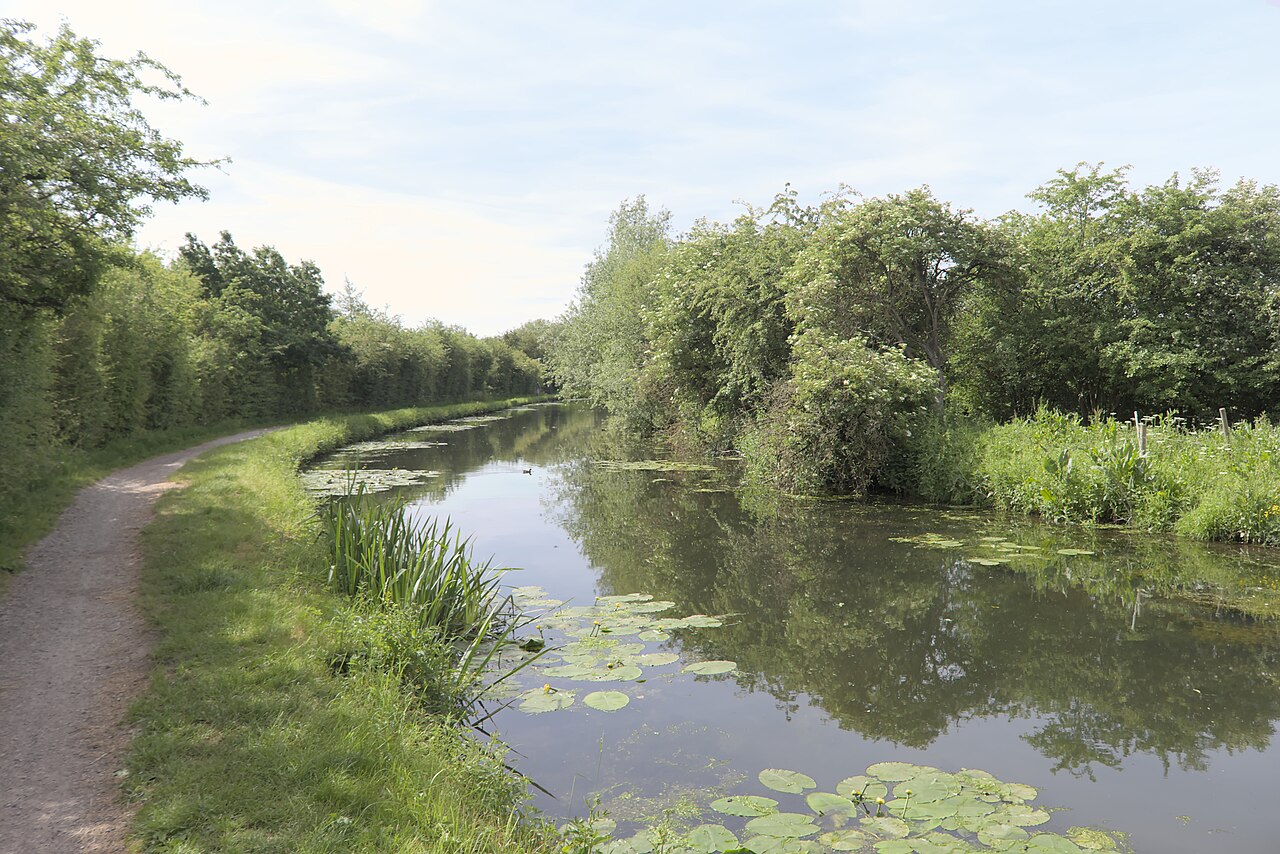
Six of the seven outfalls discharge into the River Erewash. The seventh, at Lee Lane, goes into Bailey Brook, which joins the Erewash a little downstream. The Erewash is the county boundary here, and it runs the length of the parish, past the Great Northern Basin at Langley Mill where the Erewash, Cromford and Nottingham canals meet.
This is water people walk their dogs beside, fish in, and moor boats on.
One thing this page does not claim: that the sewage gets into the canal. The pump house at Langley Mill Basin does back-pump, but it lifts water from the Erewash Canal below Langley Bridge Lock up into the basin above it: canal water, recirculated round a lock, not water taken from the river. The basin above is fed from the Nottingham Canal feeder off Moorgreen reservoir. The river and the canal run side by side here and are easy to conflate, which is exactly why it is worth being precise about it. (The pump house itself is a Victorian sewage pumping station that Severn Trent were going to demolish; canal volunteers hold it on a 99-year lease.)
_-_30_May_2026.jpg)

_-_30_May_2026.jpg)
What state the river is in
The official assessment
The Environment Agency classifies every stretch of river in England. Our reach, the Erewash from Nethergreen Brook down to Gilt Brook, the water that runs past Langley Mill, is classified Poor.
It was Moderate in 2013, 2014 and 2015. It dropped to Poor in 2016 and has stayed there through every assessment since. Four measures are below good: phosphate and the plant life are Poor, the invertebrates and the dissolved oxygen are Moderate. Invertebrates are the ones that tell you most: they live in the riverbed and cannot swim away from a bad week.
The Agency also records why, pressure by pressure, with a certainty against each. For this stretch it lists twenty reasons. Farming and urban run-off appear, marked Probable. Two are marked Confirmed, the Agency’s highest level, and both are sewage:
“Sewage discharge (intermittent)” is the Agency’s term for a storm overflow. So the regulator has already concluded, and published, that the overflows on this page are one of the confirmed reasons this river is in poor condition. That is not my claim. It is theirs.
One thing to be straight about. The river also fails its chemical status, and has since 2019, but not because of sewage: the substances responsible are PBDEs, PFOS and mercury compounds, which are persistent industrial pollutants found in nearly every river in England. That failure is real and it is not Severn Trent’s. The ecological failure, the one the Agency attributes in part to sewage, is the one this page is about.
Water Framework Directive classification for water body GB104028052511, from the Environment Agency’s Catchment Data Explorer, latest data updated 17 March 2025. Element results are the 2022 assessment. Certainty levels are the Agency’s own: Confirmed, Probable, Suspected.
And what comes out of a bottle
The classification is an assessment. This is measurement. The Environment Agency samples these waters roughly monthly and publishes every result, so the parish’s own brook can be looked at rather than a reach average.
Bailey Brook, sampled at Milnhay Road, a few hundred metres below the Lee Lane outfall, normally carries about 0.10 mg/l of ammonia. That was its average every year from 2015 to 2021. Then:
In 2022 the average was seven times that, with a single sample at 3.50 mg/l. In 2025 it was eight times, peaking at 2.60. And in 2025 the dissolved oxygen in the same brook fell to its lowest in the record.
Ammonia rising while oxygen falls is what sewage does to a watercourse. Ammonia is the sharpest chemical signal of it in freshwater, and the oxygen goes because breaking it down consumes it. That is also the pairing the Environment Agency lists sewage against, above.
These are monthly spot samples, so a peak is a snapshot of one morning rather than a measure of how long anything lasted, and this page does not claim a particular discharge caused a particular reading. What it shows is that the brook running through this parish has twice in four years carried many times its normal ammonia load. Figures are annual means of all results at that point, from the Environment Agency’s Water Quality Archive.
There is a sampling point on the Erewash immediately upstream of Milnhay works, which would let anyone compare the river above and below the works directly. It has recorded nothing since 2015. If you write to the Environment Agency, that is a good question to put to them.
It does not start at our boundary
Everything upstream comes through here
The Erewash rises near Kirkby-in-Ashfield and runs about 40 km south to the Trent, forming the Derbyshire and Nottinghamshire border for most of that. Our parish holds 8.3 km of it, and the seven outfalls on the map above are the ones inside that stretch. They are nowhere near all of them.
Severn Trent operate 83 monitored storm overflows in this river’s catchment. Thirty-seven of them are upstream of us: nineteen on the Erewash above us, fourteen on Bailey Brook, four on Nethergreen Brook. Every one of those drains into water that then flows through this parish.
So the river reaching Langley Mill has already taken the discharges of Pinxton, Somercotes, Ironville, Pye Bridge, Jacksdale, Brinsley and Eastwood on the Erewash, and of Codnor, Loscoe and Heanor down Bailey Brook. By the time it gets to us it is carrying more than five times as many outfalls’ worth of sewage as we add to it.
That cuts both ways and both ways are worth saying. We are not only producing this: we are receiving a great deal of it. And what leaves here does not stop at the boundary either: another 40 outfalls discharge into the Erewash below us, and all of it goes to the Trent.
Worked out hydrologically, not by looking at the map. Each outfall carries a Water Framework Directive waterbody reference in the Environment Agency’s return, the Agency’s own division of the river into reaches, and those are placed along the river’s actual course, taken from OpenStreetMap, to give every outfall and every point of our boundary a distance downstream. Upstream means the water enters above the point the river enters the parish, which puts our own Lee Lane outfall in the upstream count: it discharges into Bailey Brook a few metres before the brook reaches us. Counts monitored Severn Trent storm overflows only, so it is a floor: not unmonitored assets, not other companies, not farm or road runoff.
And storm overflows are not the only things discharging
Everything above is about storm overflows, because those are the ones with an Event Duration Monitor on them and therefore a published number of hours. The Environment Agency’s public register of permitted discharges shows what else is licensed to go into the water here. Inside the parish there are nine permitted discharge points across seven permits, and two of them are not in anything counted on this page.
The register still lists a continuous discharge of treated final effluent at Milnhay. That is what a sewage works is for, it is properly permitted, and it is not a spill. It is also very likely out of date, for the reason above: Milnhay stopped being a treatment works in 2024. When the register and the ground disagree, the register does not tell you which is which.
There is also a permitted sewage discharge into the Erewash at the Cornwood Meadows industrial site, roughly a kilometre north of Langley Mill. It is a Severn Trent pumping station, the permit is active, and it discharges to the river. It does not appear in the Environment Agency’s Event Duration Monitoring return for any year from 2021 to 2025. There is no monitor on it, so there is no number for it: not zero, just nobody counting.
The remaining permit is a private septic tank, and it discharges to ground through a soakaway rather than to the river, so it is not part of this.
From the Environment Agency’s public register, “Consented Discharges to Controlled Waters with Conditions”, filtered to the parish boundary by the grid reference of each discharge point. Active permits only. One outfall sits close enough to the boundary that its permitted discharge point falls just outside it while the monitor itself is inside; it is counted as ours throughout, because it discharges into Bailey Brook a few metres before the brook reaches us.
What you can actually do
Complaints are counted. A regulator that receives four letters about an outfall behaves differently from one that receives none. Start anywhere on this list. The one to your MP opens a message already written, which you can change before you send it.
1. See it happening? Report it first
Sewage in the water, grey scum, sanitary waste on the bank, dead fish. Report it the same day, because evidence goes stale.
Environment Agency incident hotline
0800 80 70 60, 24 hours
Severn Trent
0800 783 5000
Note the time, the outfall, and take a photograph with a landmark in shot.
2. Your MP
Permits and investment are set by government. This is the lever that actually moves.
Linsey Farnsworth MP
Amber Valley
Find current contact details at members.parliament.uk or writetothem.com.
3. Amber Valley Borough Council
Environmental health, and a statutory consultee on planning that adds load to this sewer network.
Ask what representations the council has made to Severn Trent about the Milnhay works, and whether sewer capacity is assessed before new housing is approved.
4. Derbyshire County Council
Lead local flood authority, and responsible for the highway drainage that feeds these combined sewers.
5. Ofwat and the CCW
Ofwat sets what Severn Trent may spend and charge. The Consumer Council for Water handles complaints about the company.
Complain to Severn Trent first; the CCW will ask whether you have.
6. Your parish council
Aldercar and Langley Mill Parish Council can write to Severn Trent, the Environment Agency and the borough as a body. That carries more weight than one resident.
Meetings are public. Ask for this to go on an agenda.
Check the contact details before you send
Councils and regulators change their forms and addresses. The links above go to the organisations’ own sites so you always land on the current route in. If one of them breaks, tell me and I will put it right.
Why I am doing this
I run a dog walking business here. That means I am out in this parish every day, in all weathers, along the Erewash and Bailey Brook and round the Great Northern Basin. Not occasionally, not on a nice afternoon in June, but every day of the year. I also spent a good while mapping the parish boundary on foot, which meant walking the length of the river.
You do not do that for long without noticing the state of it. I do not let the dogs I walk go in the water. Other people’s dogs, in a parish with a river running through it, and I have to keep them out of it. That is not a statistic. That is just what it is like here now.
I am not asking you for anything on this page except one thing: complain. A hundred people complaining will do more than any one person can.
Everything here comes from published data and every source is linked below. The code that gathers it and works out these figures is public too, at github.com/jdtanner/bearded-buddy-sewage, so anyone can check the arithmetic or run it themselves. If you think a number on this page is wrong, tell me and I will either fix it or show you the working.
Get in touch: hello@beardedbuddy.com
Sources and method
- Spill hours and counts: EDM Storm Overflow Annual Return, Environment Agency, 2020–2025. These are the figures Severn Trent files by law.
- Individual discharges: EDM Start/Stop Detailed Data, Environment Agency. Published for 2024 onwards only, which is why the dry-day test covers those years and not earlier ones.
- Live status, and this year’s running total: Severn Trent Storm Overflow Activity, checked every five minutes. That feed only reports the most recent discharge at each outfall, so this site keeps its own record of every one rather than relying on anybody else’s.
- Rainfall: daily totals from six Environment Agency rain gauges between 5.7 km and 14.2 km away. (The Agency’s other API, flood-monitoring, keeps only about a month of readings and cannot answer a question about last year.)
- Parish boundary: the published boundary record for Aldercar and Langley Mill.
- The Milnhay and Newthorpe scheme: the £35.8 million rebuild, the decommissioning of Milnhay as a treatment works and the storm tank capacity going from 2 Ml to 7 Ml are as described on Wikipedia’s River Erewash article and its sources.
- Dry-day definition: Environment Agency.
Checks worth knowing about. The hours derived from the individual discharge records match the annual return exactly for both 2024 and 2025, from two separately published files, giving 1,118.8 and 699.7 hours. Where an outfall filed no figure for a year it is shown as “not reported” rather than as zero, and the two cases here are explained above rather than left hanging. Monitors ran between 65% and 100% of the reporting period, so the totals are floors, not ceilings.
An earlier version of this page put the dry-day count at one rather than two. It used a gridded weather model for rainfall instead of the Environment Agency’s gauges; the model ran about 9% wetter than the gauges, which is enough to hide a dry day at a 0.25 mm threshold. The figures on this page now come from measured rainfall. If you find something else wrong, please say so.